Editor’s note: Below is what Jon sent his Markman’s Strategic Options subscribers before the markets opened this morning. With the broad markets in the red, down about 1.5% apiece, we think all of his readers may find this information useful for navigating the markets today.
Stocks ripped higher on Friday after a government data release showed that U.S. companies added more jobs than expected in April. Yet all of that upside and much more is under attack as China trade talks came under a cloud Sunday night.
The Dow Jones Industrial Average jumped 100 points at the opening bell on Friday, then tacked nearly a hundred more before finishing with a 196-point gain, or 0.75%, erasing a couple of prior days of losses. The S&P 500 rose 0.9%, the Nasdaq 100 rose 1.6%, and the Russell 2000 led with a 1.98% gain. Advancers outpaced decliners by a 3-to-1 margin, and yet there were still 286 new one-year highs vs just 48 lows, which is a strangely oversold level.
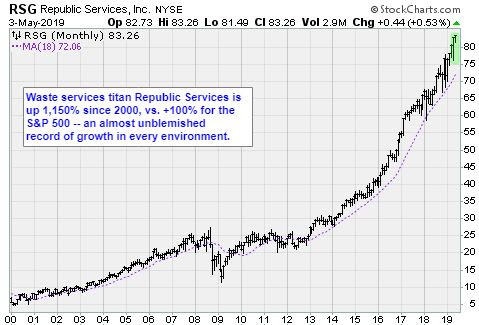
Leading the way for big caps on the new high list were railroad Union Pacific (UNP), American Express (AXP), Starbucks (SBUX), Danaher (DHR), railroad CSX (CSX), T-Mobil (TMUS), utility Southern (SO), Dell Technologies (DELL), Air Products (APD), Paychex (PAYX), and Republic Services (RSG). This is a new team of leaders for the most part. Mark that down; we may have had a vanguard change.
All major big-cap indexes finished roughly flat for the week. The S&P 500 and Nasdaq are within a whisper of record highs, while the Dow is sitting 1.2% from its record level.
Stocks have continued to grind higher in recent weeks, with major stock indexes posting their best four-month start to a year since at least 1999 through the end of April. Improving U.S. economic data and better-than-expected corporate earnings have allayed investors’ concerns of an economic slowdown following a bruising end to 2018. Central banks across the world have moved to delay monetary policy tightening, reassuring investors and helping fuel a stock market rally.
The jobs report for April was above expectations, with nonfarm payrolls increasing a seasonally adjusted 263,000, the Labor Department reported Friday.
The surge in payroll employment in April kept the six-month trend above 200,000 and adds to signs that domestic demand growth has bounced back after a weak start to the year. But Capital Economics analysts observe that the drop back in hours worked and the continued weakness in the household survey measure of employment suggests that the labor market is not quite as strong as that headline gain implies.
The details of a big report like this are critical to understanding exactly what is going on. The large gain in this case was driven mostly by a rebound in hiring in the services sector, with professional and business services adding 76,000 jobs, education and health employment rising by 62,000, and leisure and hospitality payrolls growing by 34,000. There were also outsized gains in construction (+33,000). Manufacturing payrolls rose by a very slight 4,000 after no change in March. With global economic demand still subdued, factories as a whole are unlikely to add many jobs over the rest of this year.
Less positively, hours worked edged down to 34.4 from 34.5. Temporary help employment, often a leading indicator for overall payrolls, rebounded, but the average pace of gains has softened over recent months. Meanwhile, the unemployment rate declined to 3.6% from 3.8%, though only because the 103,000 decline in the household measure of employment was outweighed by a massive 490,000 fall in the labor force in April. That caused the participation rate to drop back to 62.8% from 63.0%. Average hourly earnings posted a solid 0.2% m/m gain, leaving the annual growth rate at 3.2%.
CapEcon experts conclude that the continued strength of payroll growth will reassure the Federal Reserve that the underlying fundamentals of the economy remain solid. These are the kind of reports seen at tops. I still expect a slowdown in economic growth over the rest of the year to drag employment growth lower. Such signs of weaker economic growth, together with low underlying inflation, could still lead the Fed to cut rates before year-end.
Late-breaking comment before the notes: In a couple of tweets on Sunday, the White House threatened to increase tariffs on China to 25% in the coming week if the pace of trade talks doesn’t pick up. The president seems to think this is punishment for Beijing, but as all of our readers know, tariffs are paid by American consumers, not the foreign country or its exporters. Moreover, his threats are ringing a little hollow lately — he didn’t even scare North Korea, which fired off some rockets over the weekend.
Both developments could significantly depress the mood on Wall Street Monday as they reset expectations for two issues that market participants thought had already been positively resolved. This is known in Hollywood as stepping on your applause lines.
* * *
Notes on my scorecard
— The Russell 2000 finally blew past resistance to close at its highest level since October. It’s still 7% from its record high, so we might see a rush into the small caps in the next phase of the market cycle as it has the most potential visible upside.
— Best performing index this month so far is S&P Small-Cap 600 (IJR) – it’s up 1.4%, but still 5.45 off its record high. The Dow is actually down this month so far, -0.3%, after a +2.3% April.
— Best sector so far this month is healthcare (XLV), +1%, after a -1.7% April. Worst sector this month is energy (XLE) — -2.8% and down 12.4% since its high in September last year.
— Best sector in April was financials (XLF), +9.2%, but it’s flat this month. Second best in April was communications services (XLC), +7%, and it’s also flat this month.
— Best country this month is Hong Kong (EWH) after a +3.5% April and +14.2% since its September high last year.
— Brazil (EWZ) has been up 27% since Sept 20, but it was up just 0.5% in April, and it’s down the same amount this month.
— Bespoke Investment Group analysts looked at the traits of the best stocks in April. The average stock in the S&P 500 was +3.5% in the month, which is a ton. Stocks with lower P/Es beat the ones with higher P/Es. Worst traits were ones with highest short interest (i.e. most bet against), higher price/sales ratios, and lowest market cap.
— Who would have thought this back in December: The market is off to its fourth best start of a year on record, +17% in four months. Bespoke looked at the ten best starts to a year and found the S&P 500 tended to average 2.9% in May with gains 60% of the time.
— For the rest of the year, not such a good picture. The S&P 500 averaged a May-December gain of just 3.1%, well below the average for all years. And note that in the two years that the market did trade lower, they were humdingers: -14.3% in 1987 (May-Dec) and -38.4% in 1930.
— Bespoke also ran a correlation coefficient check to see how the market fared May-Dec in years most similar to the Jan-April daily performance of the S&P 500. Turns out the most positively correlated year was 1995 — the benchmark index rose another 19.8% through year-end and never looked back on its 5/1 closing level. The analysts’ conclusion: “Based on these results, the fact that we have kicked off the year on an exceptionally strong note doesn’t suggest that the outperformance will continue, but at the same time doesn’t suggest a big reversion to the mean either.”
— Under the surface, there some are worrisome signs. The emerging markets, home builders, and semiconductors were all leaders of the rebound this year, but all three groups have been stymied since mid-April. Could be normal rotation, but keep an eye on this. Rebounds to new highs for this trio would be a great sign for bulls.
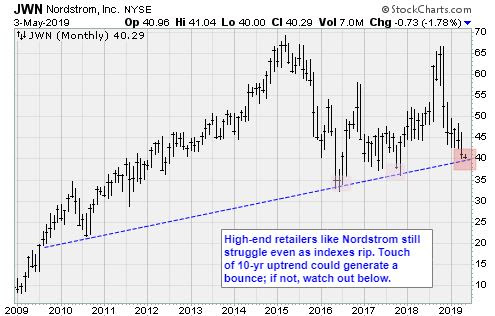
— With the resurgence of the small caps, breadth remains in good shape. The number of new highs is lagging, however. It’s as if there’s just enough motive energy to get stocks higher, but not enough to push them over the top. Also, many important groups — high-end department stores, for example — are on the ropes and threatening to break long-term trendlines. Nordstrom (JWN) above is a prime example.
— Earnings season is now more than half complete and around 1,220 companies have reported their Q1 2019 earnings reports. The earnings beat rate this season stands at 65.9%, which is up from readings seen over the prior three earnings seasons, but there are still a few weeks left, so the beat rate can still change quite a bit. The revenue beat rate is more than 10 points lower than the EPS beat rate this season, and it’s currently at its lowest level since Q3 2016, according to FactSet analysts. That’s not good, and the market might react negatively to this important data point in the coming weeks.
— Healthcare companies have the strongest earnings beat rate so far this season at 75%, according to FactSet data. Technology ranks second at 72%, followed by Consumer Staples, Industrials, and Consumer Discretionary. Utilities and Energy have the weakest beat rates so far.
— Paradoxically, negative sentiment on the part of analysts has helped pave the way to higher stock prices during this earnings season as they have made upside surprises more plentiful.
— Couple more comments about economic growth. Bespoke points out that, while April nonfarm payrolls rose much faster than forecast, the three-month average of job growth has dropped to the slowest pace since 2017. Year-over-year jobs growth is running at just a 1% pace.
— U.S. economic growth may be holding up better than the rest of the world, but it hasn’t quite been living up to expectations. Don’t get sucked into the trope that this is the best economic growth ever.
— Gasoline prices are up over 28% this year — well above the historical average of 17.6% for this point in the year, and the biggest year-to-date percentage gain through May 3 since 2011. Higher gasoline prices act like a tax on the middle class.
Thanks for reading and see you again soon.
Jon D. Markman