Recent Reversal Drives Up Momentum, But Caution Is Still Called For
Stocks were back in rally mode this week after President Trump promised to give a boost to trade talks by meeting with a top Chinese official. In front of his meeting with Vice Premier Liu He today, Trump reported “warmer feelings” and “good things are happening.”
The president always seems to mangle these encounters. So, beware of heightened volatility.
Through Thursday’s close, this breadth favored advancers by a 2-to-1 margin. There were still just 58 new one-year highs vs. 171 new lows, an oversold condition.
Leaders on the new high list were:
- Apple (AAPL)
- Walmart (WMT)
- Taiwan Semiconductor (TSM)
- ASML Holding (ASML)
- The TJX Companies (TJX)
- Dominion Energy (D)
- Sherwin-Williams (SHW)
- Sun Communities (SUI).
That’s still a very defensive market profile, but it’s nice to see retail and chips rebounding to highs. This rally has potential, particularly if we get at least one more transitory, sentiment-gutting smackdown in the next few days.
Global indexes and stock futures have swung recently between modest gains and massive losses on conflicting reports about the Chinese trade delegation.
The Wall Street Journal reported that negotiations continued Thursday after the White House signed off on special licenses for some U.S. companies to do business with Chinese telecom giant Huawei Technologies Co., a possible olive branch from the U.S. side.
At the same time, the U.S. added 28 Chinese entities to an export blacklist. So, maybe it’s a branch with previous few olives actually on it.
In any event, fears that the U.S. and China won’t reach a ceasefire on tariffs have led to projections that a global economic slowdown will ripple outward to consumers, denting spending and crimping corporate profits.
* * *
Too Bad, So Sad
This fear isn’t just in the air … it’s quantifiable.
The latest American Association of Independent Investors survey results showed another drop in optimism. The 20-week average of the Bull/Bear Ratio dropped to the second-lowest reading since the financial crisis.
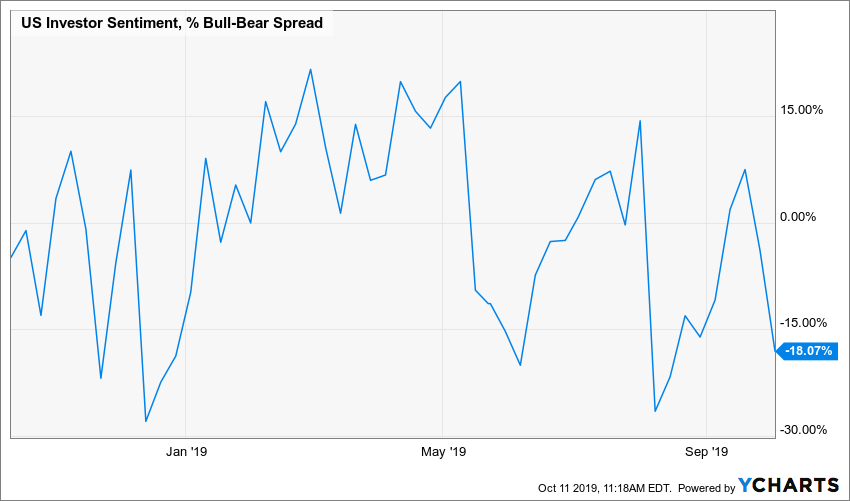
This is super-weird because the market is actually in pretty good shape, showing off one of the strongest year-to-date gains (through Oct. 10) in history. And yet I guess that’s not good enough for the folks surveyed by the AAII.
Jason Goepfert of SentimenTrader.com riffed his database to look at the forward results of the S&P 500 when the AAII Bull Ratio is depressed through the first 41 weeks of the year.
Turns out, this setup has mostly led to positive returns, with relatively low risk. A year after these signals, the S&P 500 showed a positive return every time, one averaging 11.9%.
There were some scary moments in between, especially in 2008, but over time stocks consistently recovered. Considering that Thursday was also Oct. 10, historically one of the best dates of the year to buy stocks for a 12-month holding period, it’s a positive sign.
If you want to play the AAII depression as a contrarian, buy some SPDR S&P 500 ETF (SPY) with a one-year lockup.
That said, you shouldn’t expect a major rally immediately After all …
* * *
Here Comes Old Flattop
Stocks have been stuck in a holding pattern for a while. That’s pretty rare.
Goepfert observes that the S&P 500 has now gone more than 50 days since its last 52-week high. And it’s been more than 180 days since it was in a -10% correction.
Basically, the market is asleep at the wheel.
When this has happened in the past, future returns were relatively poor over the medium term, with the flat market dragging on sentiment.
Goepfert looked at every time the S&P 500 went at least 180 days since being in a correction and hit 52 days since its last 52-week high. Over the medium to longer term, the S&P 500’s returns were below average, with risk higher than normal.
The average gain for the following three months was just +1.8%, and for the next year, only 2.3%.
This is the price of ambivalence.
And we could see a whole lot of the same going forward, as …
* * *
Earnings Slump Blunts Gains
While the market is asleep, investors will have to face companies reporting terrible earnings growth.
Goepfert observes there are lots of different ways to look at company reports. But according to him, the best studies look at operating earnings per share. By that measure, S&P is estimating that the year-over-year change in S&P 500 operating earnings for this quarter will be negative 2%, which is indeed the worst in three years.
Goepfert rifled through his database to look at what happened every time the S&P 500’s year-over-year operating earnings were not only negative, but also the worst in three years.
And he did find some doozies in there — in 1930, the subsequent one-year loss was 26.3%. In 2007, the follow-on one-year loss was 27.5%.
But there were a bunch of good results too. The average gain over the next six months was 1.6%, and the next year average was 8.7% — not amazing, but not a disaster.
However, when Goepfert filtered the signals for those quarters when the S&P 500 was within 5% of a new high (using quarterly closes), then returns suffered quite a bit, with an especially ugly risk/reward profile over the next year. The follow-on one-month average gain was -1.9% and the 12-month average was -5.3%.
* * *
Where This Leaves Us
All this might seem contrary, but it isn’t. Let me explain …
The overall momentum in the market is strong. In fact, the recent recovery from the September sell-off was one of the largest and quickest reversals in history.
But while big moves like this can mean long-term gains, they signal short-term volatility. That’s what we’re seeing now, and what’s frightening investors.
Going back again to the 1930s, Goepfert found that the average maximum gain in the S&P 500 Index was over 9% … and so was the average maximum loss.
Giant swings like that signal we’ve entered a higher-volatility market overall. So, while the handwringing and fear-mongering might be a bit overdone, smart investors should still exercise caution until markets stabilize and volatility subsides.
Best wishes,
Jon D. Markman