Stocks wriggled all week after new flare-ups in U.S.-China trade tensions undercut investors’ expectations that a resolution was around the corner.
Shares of technology, industrial and financial companies all fell hard this week as investors sliced their exposure to riskier assets and sought protection in U.S. Treasuries, utilities and real estate trusts. The trade angst also soaked energy stocks, which slid alongside a massive 5% pullback in crude oil prices. Close to 80% of stocks in the S&P 500 finished in the red on Thursday alone.
Beyond tariffs, the White House has threatened to blacklist additional Chinese technology firms. This is leading analysts to predict that the conflict could persist for longer than previously expected.
The ripple effects are now causing a sharp drop in expectations for industrial metals and energy, as copper, iron and zinc prices have tumbled.
It would be nice to see some positive developments, but just the opposite has emerged.
Late Thursday afternoon, Reuters reported that the Trump administration is taking steps toward issuing even more restrictions on exports of high-tech goods to China. The report said the Commerce Department will soon recommend rolling back regulations that ease the path for U.S. companies to export certain goods that have both civilian and military purposes.
I don’t want to sound overly dramatic, but it’s beginning to seem like the metaphoric term trade “war” is becoming more and more real. With no end in sight and the mission murky, investors are taking no chances and cutting their exposure to risk.
* * *
Tariff Escalation Will Gun Inflation
Expect the emotional swings in the market to continue until investors get more clarity on escalating tariff threats by both sides.
To understand why clarity is needed, Morgan Stanley analysts led by Ellen Zentner published a smart report Wednesday night that explained how the U.S. tariffs on Chinese imports are absorbed in five ways: 1) lower Chinese profit margins; 2) a higher U.S. dollar; 3) substitution away from Chinese imports; 4) lower U.S. profit margins; and 5) higher consumer prices.
The length of time that tariffs last is critical to understanding potential damage.
- In a temporary escalation where the 25% tariffs are in place for a short period of time, Zentner’s research shows the impact on inflation is negligible at 0.05 percentage points in 2019.
- Even if there is an extended escalation in which tariffs stay in place longer as talks continue, the impact only goes up to 0.10 percentage point.
- But if there’s no deal and the U.S. imposes tariffs on all Chinese imports as talks stall, and China responds with 25% tariffs on all U.S. purchases, the impact goes way up to 0.26 pp of inflation this year.
In the extreme “no deal” case, the economy deteriorates rapidly and falls into recession. This would place considerable lagged downward pressure on inflation, an effect that is not incorporated in these numbers, the Morgan Stanley analysts argued.
So, as you can see, it’s important for the talks to resume to keep both countries’ companies and consumers from paying a harsh price.
* * *
Tariffs Will Bite Into GDP Growth Like a Tax Hike
Now let’s see tariffs through a different lens: How they detract from economic growth.
Capital Economics researchers have determined that the latest escalation in trade tensions could become a much bigger drag on the U.S. economy than previous rounds of tariffs.
A 25% tariff on all imports from China would be equivalent to a tax worth 0.6% of GDP. Together with a further hit to U.S. exports from Chinese retaliation, the overall damage to the economy could be as large as 0.7% of GDP, the researchers report.
Most analysts had assumed the trade dispute with China would follow a similar pattern to the talks with South Korea, Canada and Mexico. In those, President Trump talked tough but ultimately accepted minor concessions.
Trump’s surprise move this month to hike U.S. tariffs on $200 billion of Chinese imports and the speed of China’s response suggests that this thinking could be wrong.
A meeting between Trump and Chinese President Xi at the G-20 meeting in late June may yet result in some sort of deal or, at least, a pause to hostilities. But there is now a serious risk that within another couple of months, tariffs will cover all U.S.-China bilateral trade.
Raising tariffs on the remaining imports from China will have a more significant impact than previous rounds.
While early rounds of tariffs targeted intermediate and capital goods, the latest proposals would mostly affect consumer goods like cell phones and computers, for which China is the dominant global supplier. CapEcon analysts argue this implies less room for substitution or for producers to absorb the impact in their margins.
With the latest round of tariffs more likely to be borne by U.S. consumers and firms, that would be equivalent to a fiscal squeeze of $100 billion, or 0.5% of GDP, the research suggests.
A fiscal tightening worth 0.5% of GDP, together with the hit to U.S. exports from China’s retaliation, suggests the overall damage could be as large as 0.7% of GDP, the analysts conclude.
With GDP growth tracking close to 2% annualized in the second quarter, that isn’t going to push the economy into recession all by itself.
The impact will also be partly offset by looser monetary conditions, with markets pricing in two interest rate cuts by the Fed in the coming year. But the swelling downside risk raises the pressure on the Fed to deliver those cuts if U.S. and Chinese trade negotiators hit a wall.
* * *
‘Perfect’ Indicator Goes Green
SentimenTrader.com on Wednesday published an upbeat note about the Moving Average Convergence-Divergence indicator, a mainstream technical analysis tool better known as the MACD.
The indicator essentially just looks at the difference between two moving averages and smooths it. It’s a way to study price momentum and is used on every time frame, though most common are daily or weekly charts.
On that weekly time frame, the momentum of the benchmark SPDR S&P 500 (SPY) has just changed from persistently negative to persistently positive.
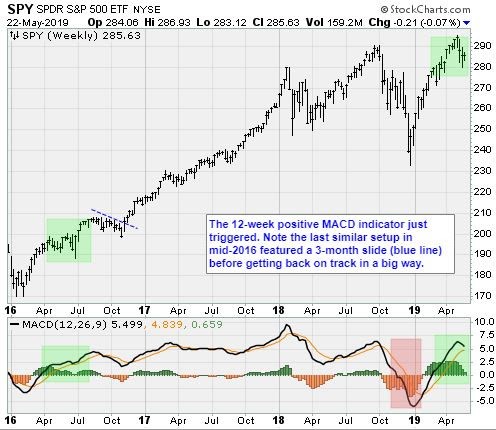
SentimenTrader notes that the signal line of the weekly MACD indicator held below the zero line for at least 12 weeks and has now sustained a move above it for 12 weeks. Once that 12th positive week is recorded, the signal is generated.
The analysts looked at every similar signal since 1950 — there were 18 instances — and determined that it was essentially perfect over a 1- and 2-year time frame. The average gain was +12.2% over the following year and +24.1% over the next two years — with no losers.
This is a plausible finding and should give bulls a warm and fuzzy feeling. The last time it triggered was June 24, 2016; the SPY was +19.7% in the next year and +33.7% in two years.
Note on the chart above that the last signal did not lead immediately to clear sailing. Soon after the signal initiated, the market went into a shallow three-month tailspin.
Bulls ultimately reasserted themselves, however, and took off on a sensational 15-month rally.
* * *
Tech Takedown & Turnaround
This is pretty weird or, least, rare.
Jason Goepfert of SentimenTrader points out that tech stocks have gone from first to worst, and this is stoking fears that one of the drivers of the broader market rally is over.
It’s rare to see one sector lead all others for months at a time, then take a hard right and plunge to last place.
The energy sector has done it a few times, utilities have done it, and so has real estate, Goepfert reports. But we’re most interested in tech, since that’s what been gone from leader to laggard in this cycle.
Goepfert screened his database to discover that, since 1928, there have been two years when tech was the best-performing sector through April and then collapsed to the worst-performer into late May, in 1954 and 1966.
Neither one was a bad omen: Tech soared more than 8.5% both times over the next couple of months, and more than 40% over the next year.
Overall, there have been nine years when one of the S&P 500’s 11 major sectors led through April and then was the worst-performing sector in the following month. On average, those sectors ended up performing third-best through the rest of the year, and no worse than eighth.
In other words, the sectors that go from best-performer YTD all the way down to the worst over the past three weeks have usually gone on to revert to its excellent performance and regain its crown as best performer over the rest of the year.
Bottom line: The unloved SPDR Tech (XLK) ETF is probably a buy around here for at least a six-month hold.
XLK may be a good trade. As for what you can invest in, my Power Elite portfolio strategy has shown an average return of 15.6% over the past 16 years, which could turn $10,000 into $118,000, $50,000 into $592,000 and $100,000 into well over a million dollars by the time you retire. If you aren’t invested in stocks that grow double-digits each year, click here to see how we are doing that right now.
Best wishes,
Jon D. Markman